Free templates · Root cause analysis
Root cause analysis templates fishbone, 5 whys and an RCA report.
Download a fishbone diagram template in Excel that draws itself from your list of causes, with 5 whys, an action plan and a bowtie, plus an RCA report template in Word. In English and Arabic, and free.
- Excel and Word
- English and Arabic
- Based on IHI’s root cause analysis tools
Free templates
Fishbone, 5 whys and RCA report templates
Yellow cells in the workbook are where you type; everything else updates by itself. In the report, replace the text in [square brackets].
- Root cause analysis workbook (Excel)A list of causes, a fishbone diagram that draws itself from it, 5 whys, an action plan that flags overdue actions, and a bowtie.Download the workbook
- Root cause analysis workbook in Arabic (Excel)The same workbook in Arabic.Download the Arabic workbook
- RCA report template (Word)From the event to sign-off: timeline, a printable fishbone, two 5 whys chains, root causes, actions rated by strength and follow-up.Download the template
- RCA report template in Arabic (Word)The same report template in Arabic.Download the Arabic template
Authorized vendor to
- Ministry of Finance
- Ministry of Interior
- DGE Abu Dhabi
- Etihad Aviation
- EDGE Group
Delivered for
- Hindustan Unilever
- Nokia
- Linde
- USA Today
- JSL
Procurement-ready
- Emirati national company
- National ICV certificate
- Abu Dhabi Government Procurement Gate
- UAE Ministry of Finance, federal procurement
- Registered ADNOC vendor
What’s inside
A fishbone that draws itself
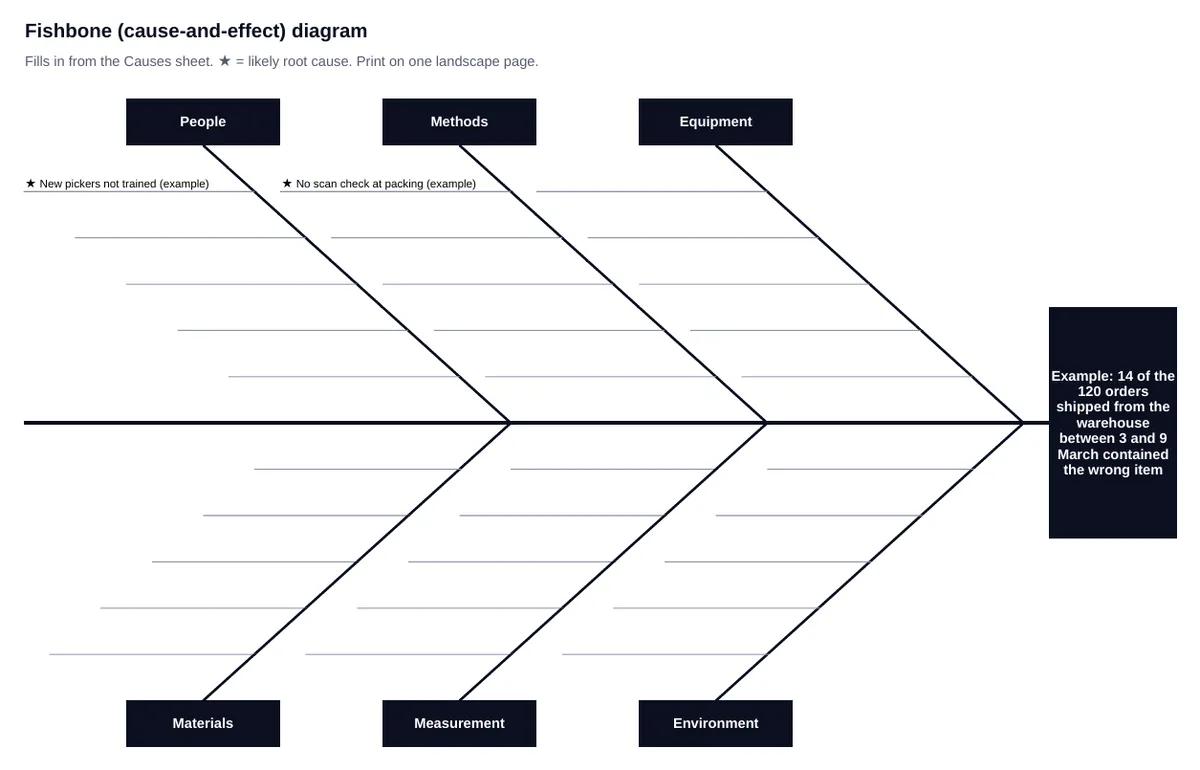
List the causes, get the diagram
Write the problem and list causes under six categories on the Causes sheet. The fishbone fills in, ready to print on one landscape page, and likely root causes get a star.
- Six categories to start from: People, Methods, Equipment, Materials, Measurement and Environment
- Rename the categories to fit your problem
- 5 whys for up to three causes, with a column for evidence
- An action plan that rates each action’s strength and turns red when it is overdue
How to run an RCA
How to do a root cause analysis
- 01
Contain the problem
Make the situation safe and stop the harm spreading before you investigate.
- 02
Write the problem statement
One sentence: what went wrong, where, when and how much, without causes or solutions.
- 03
Map the causes
In a session with the people who do the work, list possible causes under each fishbone category.
- 04
Ask why
For each likely cause, ask “Why?” until you reach one you can act on, and check each answer against evidence.
- 05
Choose strong actions
Prefer actions that change the system over reminders and retraining, and give each an owner and a date.
- 06
Check it worked
Measure whether the problem has stopped, and share what you learned with other teams and sites.
Which method when
Fishbone, 5 whys and bowtie
Fishbone diagram
Widens the search. It sorts the possible causes of a problem into categories, so the team looks past the first explanation. Also called an Ishikawa or cause-and-effect diagram.
5 whys
Narrows it down. Follow one cause by asking “Why?” until you reach one you can act on; it may take fewer or more than five. IHI attributes the method to Taiichi Ohno of Toyota.
Bowtie
Looks ahead. For a risk you want to prevent, it maps the threats, the barriers that stop each one, the top event and its consequences.
Choose actions that last
Strong, intermediate and weak actions
From IHI’s Action Hierarchy, part of RCA² and based on the VA National Center for Patient Safety. IHI recommends at least one strong or intermediate action for every root cause analysis.
Strong
Changes the system so the error is hard to make: physical or design changes, forcing functions, simpler processes, standard equipment.
Intermediate
Makes the error less likely or easier to catch: checklists, redundancy, software changes, less workload.
Weak
Relies on people remembering: training, warnings, a new policy or memo, double checks.
Next steps
Run every investigation the same way
Sources
Sources
Checked on 15 November 2026.
- Cause and Effect Diagram (Institute for Healthcare Improvement)
- 5 Whys: Finding the Root Cause (Institute for Healthcare Improvement)
- RCA²: Improving Root Cause Analyses and Actions to Prevent Harm, with the Action Hierarchy (IHI)
- Root Cause Analysis primer (AHRQ Patient Safety Network)
- Bow Ties in Risk Management: A Concept Book for Process Safety (CCPS and Energy Institute, 2018)
Book a demo
See Basira RCA on one of your own events
Bring a recent incident or near miss. A product specialist will walk you through triage, a logic tree and corrective actions on a call, in Arabic or English.
- A live demo, not slides
- Built around one of your own events
- A reply within one business day
4.9/5 average rating · 98% client satisfaction · 150+ clients served
FAQ
Root cause analysis, answered
What is a fishbone diagram?
A cause-and-effect diagram, also called an Ishikawa diagram. The problem sits at the head, and the possible causes are grouped into categories along the bones, so a team can see them all at once.
Is there a fishbone diagram template in Excel?
Yes. The free workbook draws the fishbone from the causes you list, and the Word report template includes a printable fishbone for team sessions.
What categories go on a fishbone diagram?
A common set is People, Methods, Equipment, Materials, Measurement and Environment. IHI’s classic categories are Materials, Methods, Equipment, Environment and People, and service teams often use People, Policies, Procedures and Systems.
How do you use the 5 whys?
Start with the problem and ask why it happened, then ask why that happened, and repeat until you reach a cause you can act on. Check each answer against evidence; one problem often needs more than one chain.
What are the steps of a root cause analysis?
Contain the problem, define it in one sentence, map the possible causes, test the likely ones with 5 whys and evidence, choose and carry out actions, and check that they worked.
What is a bowtie diagram?
A risk diagram with the top event, the moment control is lost, in the middle. Threats and the barriers that prevent them are on one side, and consequences and the barriers that reduce them on the other.
Are the templates free?
Yes. Download them, change them and use them in your organisation, with no sign-up.
Find the root cause, every time
Book a live Basira RCA demo on one of your own events.
Book a Basira RCA demo